| Include Page | WCS5EN:Accessory tools | WCS5EN:Accessory tools
|---|
| Table of Contents |
This section describes accessory tools that can be used to manage the WCS server.
Port routing checking
The WCS server may be behind NAT and as such it will require a port range opened for the external network, for instance, UDP 31000-32000.
This means that a UDP packet sent from the external network to the port in that range should reach the server where WCS is placed.
Hence, we have a simple test. Send a UDP packet from outside using nc and receive it on the server using tcpdump.
If the packet reached, the port is open.
nc
| Code Block | ||||
|---|---|---|---|---|
| ||||
echo -n "hello" | nc -4u -w1 wcs1.com 31000 |
or for Debian:
| Code Block | ||||
|---|---|---|---|---|
| ||||
echo -n "hello" | nc -u -w1 wcs1.com 31000 |
This command sends a simple UDP packet in the given direction.
tcpdump
| Code Block | ||||
|---|---|---|---|---|
| ||||
tcpdump udp port 31000 |
This command makes the server listen for a particular port and immediately outputs information about packet arrival to the console:
| Code Block | ||||
|---|---|---|---|---|
| ||||
17:50:21.932509 IP myhost.39194 > host.31000: UDP, length 5 |
jstack tool
This is Java utility that provides important information about a Java process and execution threads.
When you run jstack from the console, a brief information about jstack is shown:
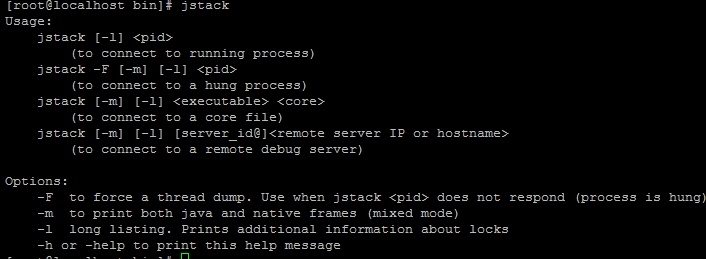
If the information is not shown or the jstack utility is not found, use the installation instruction to latest version of JDK. After installing jdk you should create a symbolical link to jstack to quickly run it:
| Code Block | ||||
|---|---|---|---|---|
| ||||
ln -sf /usr/java/default/bin/jstack /usr/bin/jstack |
Example:
| Code Block | ||||
|---|---|---|---|---|
| ||||
jstack 8888 > jstack.report |
Here, 8888 is the ID of the Java process.
Since build 5.2.801, WCS is running from 'flashphoner' user for security reasons. Therefore, jstack should be launched from the same user if using JDK 8:
| Code Block | ||||
|---|---|---|---|---|
| ||||
sudo -u `ps -o uname= -p $(pgrep java)` `which jstack` `pgrep java` |
Testing channel bandwidth using iperf
A stream published picture quality depends on channel bandwidth between publisher and server, the same for subscriber. Channel bandwidth can be checked using iperf utility. This program is implemented for all major OS: Windows, MacOS, Ubuntu/Debian, CentOS. iperf in server mode can be installed and running with WCS, that allows to check whole channel bandwith from publisher to viewer.
iperf can be installed on CentOS 7 as follows:
| Code Block | ||||
|---|---|---|---|---|
| ||||
yum install iperf3 |
Run iperf in server mode
| Code Block | ||||
|---|---|---|---|---|
| ||||
iperf3 -s -p 5201 |
where 5201 is iperf port for testing client connections
On client side iperf can be launched as follows:
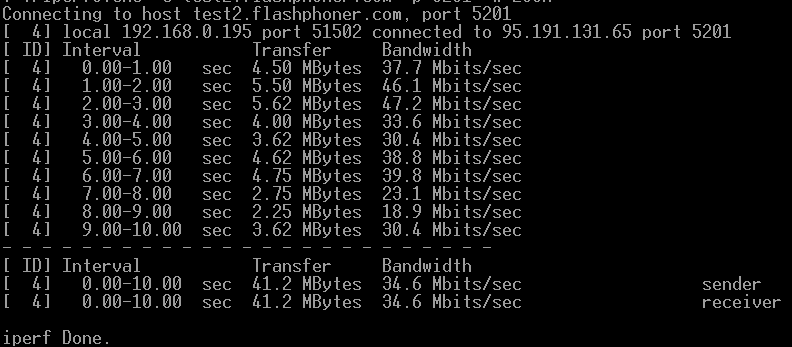
1. To test upload channel bandwith via UDP (Windows example)
| Code Block | ||||
|---|---|---|---|---|
| ||||
iperf3.exe -c test2.flashphoner.com -p 5201 -u |
Where
- test2.flashphoner.com - WCS server
- 5201 - iperf port to connect
The result of the command above should look like this:
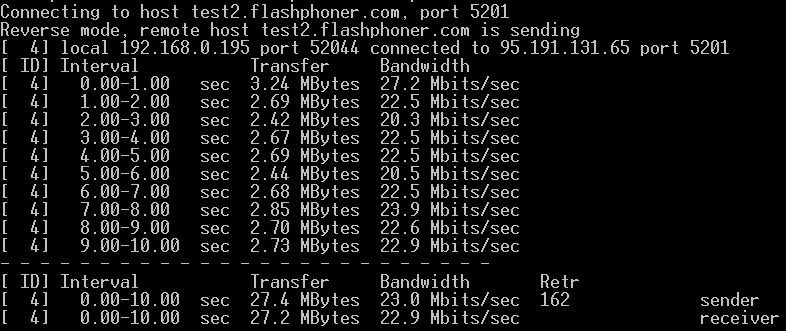
2. To test download channel bandwidth via UDP
| Code Block | ||||
|---|---|---|---|---|
| ||||
iperf3.exe -c test2.flashphoner.com -p 5201 -u -R |
Where
- test2.flashphoner.com - WCS server
- 5201 - iperf port to connect
The result of the command above should look like this:
By default, iperf tests the channel for 10 seconds. This interval should be increased, for example, to 120 second
| Code Block | ||||
|---|---|---|---|---|
| ||||
iperf3.exe -c test2.flashphoner.com -p 5201 -u -t 120 |
The upload channel bandwidth test via UDP result shows the maximum video publishing bitrate without packet losses. In the sample above bitrate should be limited with 1000 kbps, on server side for example
| Code Block | ||
|---|---|---|
| ||
webrtc_cc_max_bitrate=1000000 |
Note that iperf major versions on server and on testing client should be the same. Today version 3 is actual, but ther is also version 2 in repositories.