Monitoring of network activity in a browser
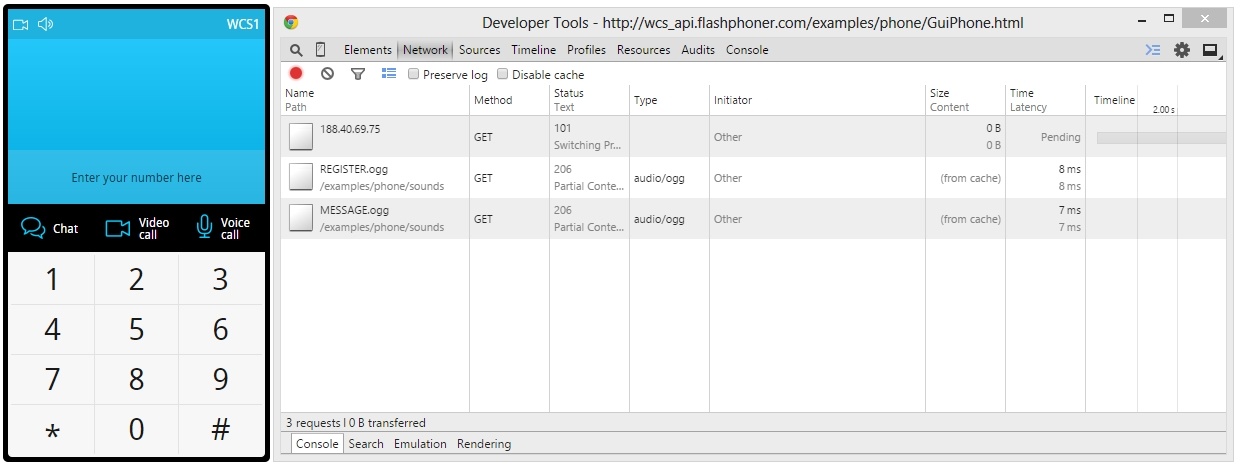
Connection and signal information exchange is accoimplished via the Websockets protocol. To get additional information, open the debug console of the Chrome browser - 'Developer Tools'. On the 'Network' tab there is the IP address of the server, Websocket connectioin is established with. In this case: 188.40.69.75.
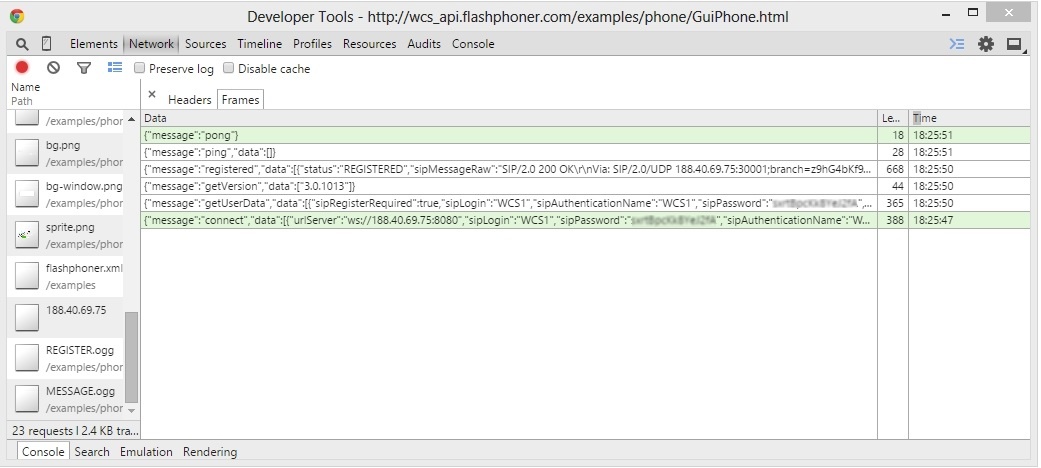
Websocket frames that flow between the browser and the server
The debug console of the Chrome browser displays data going between the browser and the WCS server via the Websocket protocol. These requests have nothing to do with WCS JavaScript API, but nevertheless demonstrate that the traffic does flow and there is some data exchange. If there is not data exchanging happening, this is a sign of some error.
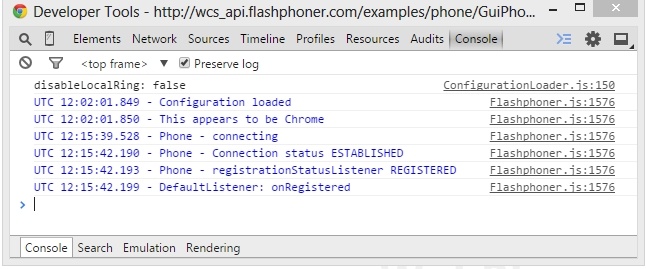
Debug logs on the 'Console' tab
A front-end developer may need these logs to understand what's going on inside the test app and the Phone.js script, and also inside the Flashphoner.js implementation. You can read more about WCS JavaScript API in the Web SDK section.
Websocket traffic
In Wireshark, Websocket traffic between the web client and the WCS server looks as follows:
In this example, a Websocket filter is set, so you can see all Websocket-packets running between the client and the server.
Possible problems
The lack of Websocket traffic can indicate web client or the WCS server configuration problems or improper Firewall settings or routing. Errors in the debug console of a browser can point to problems in the code or in web client settings.
Troubleshooting
Make sure the WCS server is running and is listenning to the Websocket port 8080 (by default) and accepts connections to this port. Check availability of the port using the following command:
telnet 192.168.1.5 8080
where 192.168.1.5 is the IP address of your WCS server. Make sure the WCS server records corresponding logs when establishing connection and these logs do not have obvious errors.


