Memory management in Java
Heap memory tuning
Many data objects are created and destroyed in memory while streaming. Therefore, it is recommended to allocate at least 1/2 of server physical memory for Java memory heap. For example, if server RAM is 32 Gb, then it is recommended to allocate 16 Gb with the following settings in wcs-core.properties file:
Garbage collector tuning
Garbage collector (GC) is an important part of Java VM. When GC is running, it dramatically increases the server load and may stop execution of other tasks; therefore, it is recommended to minimize the number of GC invocations using the following settings in wcs-core.properties file:
# Use System.gc() concurrently in CMS
-XX:+ExplicitGCInvokesConcurrent

# Disable System.gc() for RMI, for 10000 hours
-Dsun.rmi.dgc.client.gcInterval=36000000000
-Dsun.rmi.dgc.server.gcInterval=36000000000
Concurrent Mark Sweep (CMS) Garbage Collector
The Concurrent Mark Sweep (CMS) collector is designed for applications that prefer shorter garbage collection pauses and can afford to share processor resources with the garbage collector while the application is running. This collector should be considered for any application with a low pause time requirement.
1. Сonfigure CMS GC in the wcs-core.properties (For example, allocating 24G under memory heap and tuning the NewSize and MaxNewSize parameters to control the new generation’s minimum and maximum size by setting these sizes to be equal. In general, keep the Eden size between one fourth and one third of the maximum heap size)
# Used CMS GC
-XX:+UseConcMarkSweepGC -Xms24g -Xmx24g -XX:NewSize=6144m -XX:MaxNewSize=6144m

# Disable heuristic rules
-XX:+UseCMSInitiatingOccupancyOnly

# Reduce Old Gen threshold
-XX:CMSInitiatingOccupancyFraction=70

# Log
-Xloggc:/usr/local/FlashphonerWebCallServer/logs/gc-core-
-XX:ErrorFile=/usr/local/FlashphonerWebCallServer/logs/error%p.log
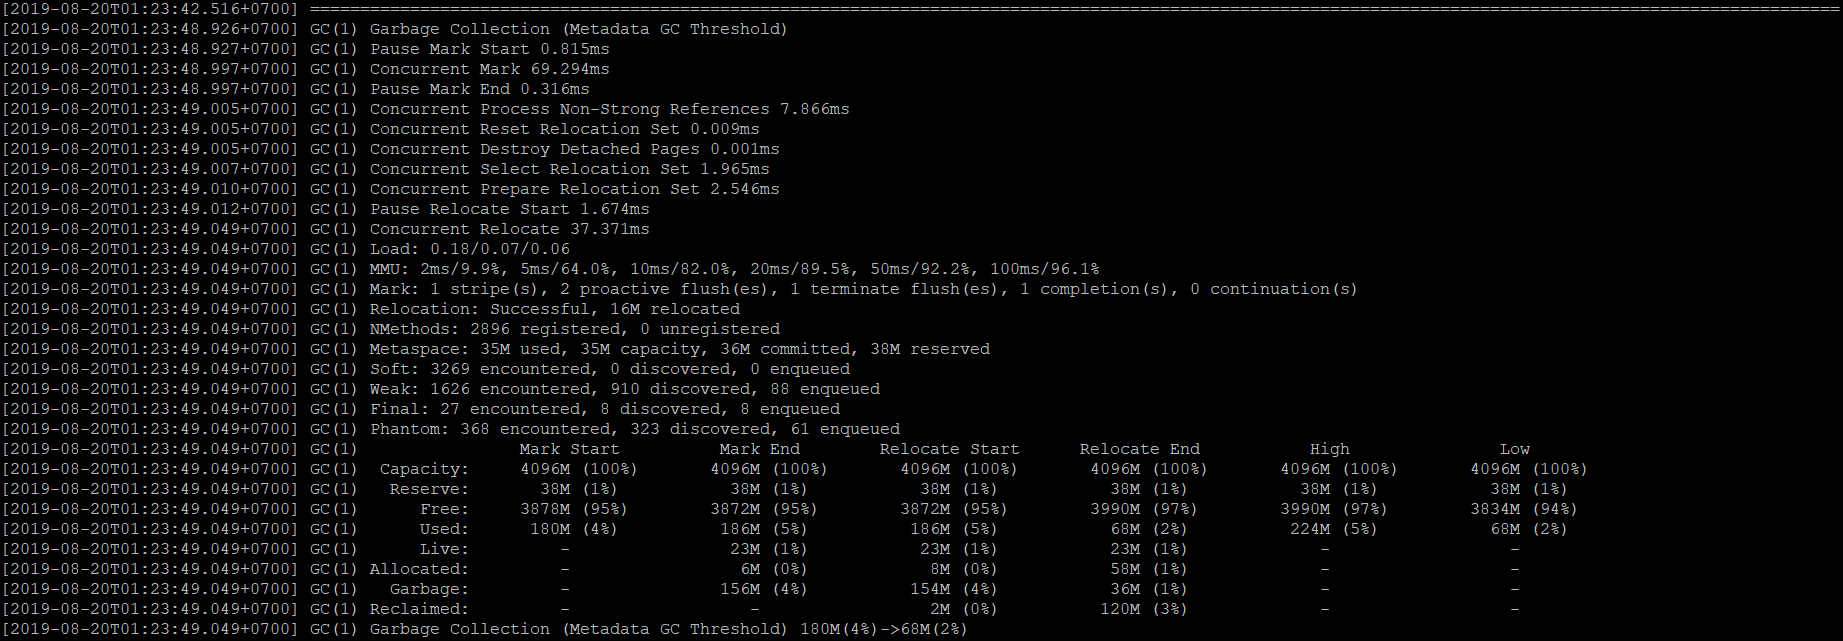
2. After restarting WCS, we can see the result of the garbage collector in the gc-core.log log file. The output may vary depending on the installed version of Java. For example,
openjdk version "1.8.0_222":

openjdk version "12.0.2":

The Z Garbage Collector
The Z Garbage Collector (ZGC) is a scalable low latency garbage collector for Java 12. ZGC performs all expensive work concurrently, without stopping the execution of application threads for more than 10 milliseconds, which makes it suitable for applications requiring low latency and/or use a very large heap. It should be noted that ZGC requires more processor resources than CMS GC.
Here is the example of ZGC setup using OpenJDK 12:
1. Install OpenJDK 12 as described here
2. Verify your Java installation:
java -version

openjdk 12.0.2 2019-07-16
OpenJDK Runtime Environment (build 12.0.2+10)
OpenJDK 64-Bit Server VM (build 12.0.2+10, mixed mode, sharing)
3. Install WCS (if required).
4. If WCS is already installed, comment or remove the following lines in wcs-core.properties file
-XX:+UseConcMarkSweepGC
-XX:+UseCMSInitiatingOccupancyOnly
-XX:CMSInitiatingOccupancyFraction=70
-XX:+PrintGCDateStamps
-XX:+PrintGCDetails
Change the following line from
to
5. Add the following setting to wcs-core.properties (for example, allocating 24G under memory heap):
- in JDK 12-15
- in JDK 16 and newer
6. If hugepages is planning to use, add the following settings to wcs-core.properties:
- in JDK 12 or 14
- in JDK 15 and newer
Then configure hugepages according to the recommendations (the number of memory pages (2048K each) with a margin to the memory for heap 1,125 * 24G * 1024 / 2M) and add the required parameters in the server startup (Centos example):
sudo mkdir /hugepages
sudo echo "echo 13824 >/sys/kernel/mm/hugepages/hugepages-2048kB/nr_hugepages" >>/etc/rc.local
sudo echo "mount -t hugetlbfs -o uid=0,mode=0757 nodev /hugepages" >>/etc/rc.local
sudo chmod +x /etc/rc.d/rc.local
sudo systemctl enable rc-local.service
sudo systemctl restart rc-local.service
sudo chmod o+w /hugepages
7. After restarting the WCS, the gc-core.log log files show the periodic operation of the garbage collector. To understand the working model of Z Garbage Collector, you can see this presentation.

Physical memory allocation tuning on system level
When server is under a high load, there can be not enough a physical memory map areas which are avalable to a proccess in system by default. This can lead to JVM crash due to lack of native memory. In this case, crash log contains the following comment:
#
# There is insufficient memory for the Java Runtime Environment to continue.
# Native memory allocation (mmap) failed to map 12288 bytes for committing reserved memory.
# Possible reasons:
#   The system is out of physical RAM or swap space
...
To prevent such crashes, increase memory map areas count available to a procces with the following system parameter
and restart WCS.
Known issues
1. CPU load average is higher when ZGC is used, especially in JDK 15
Symptoms
CPU load average measured at system level (using htop for example) grows after update from JDK 12 or 14 to 15 if ZGC is used
Solution
Use ZGC in JDK 12 or 14 only fro high loaded servers if GC pauses minimizing is required
2. ZGC logs may occupy a huge disk space with default output configuration
Symptoms
gc-core*.log files occupy a huge disk space